Still using Burndown Charts?
Like WOW! Are you from the 80s?
Yes, Burndown charts can be useful if used correctly. The thing is, they hardly ever are. This makes them as a standalone tool for measuring progress in a Sprint, towards a Release or Product rather useless, much less serving as a tool for decision making.
But why, Terryll, why are they useless?, I hear you cry. It’s because of us humans and our multiple, ingenious ways to manipulate them. And by using them in a way they are not intended to be used.
Tell me how you measure me and I will tell you how I behave. – Dr. Eli Goldratt
The Idea of Burndown Charts
I do not remember the last time I looked at a Burndown chart, I honestly don’t. Well, I did look at some to research this blog post, but I mean in a professional environment, I don’t.
At my current employer BASTION, we used Burndown charts when we started with Scrum. That was right after we transitioned from Waterfall.
With the team being new to Scrum, they were not thinking about how to make the Burndown chart look better than reality to satisfy management or stakeholder expectations.
Or how we can have a shiny Velocity graph even if it’s not really true.
The team was not thinking about manipulation or gaming a system, they were busy getting their heads around that Scrum idea and how to craft better Goals.
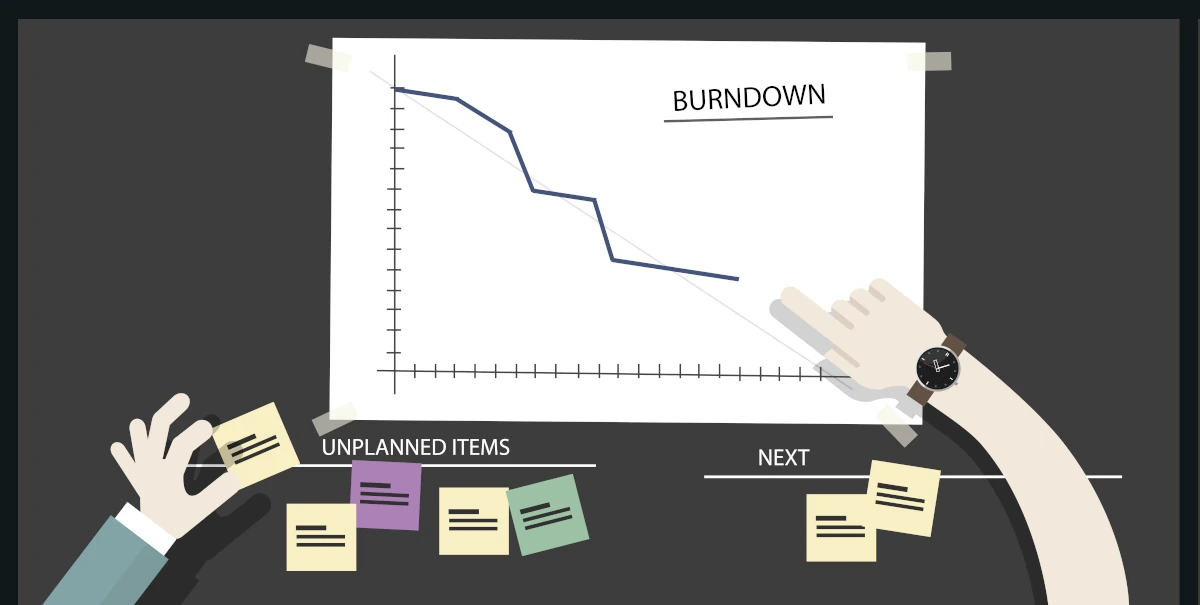
Burndown and burn-up charts are common tools in Scrum and agile project management, primarily used to measure progress. A Burndown chart plots outstanding work against time, while a Burn-up chart plots completed work against time.
These charts are intended to help teams monitor their pace, adjust their work efforts, and identify any potential issues early on. It really is information mainly for the development team itself.
Misinterpretation of Data
One of the main issues with both burndown and burn-up charts is that they can be easily misinterpreted by stakeholders who are not familiar with how to read them. For example, a sharp drop in a burndown chart might be incorrectly seen as a sign of excellent progress when it might actually be due to scope reduction or overestimation of tasks initially.
Focus on Completion Rather Than Value:
Burndown and burn-up charts focus on the completion of tasks, which may not necessarily correlate with delivering value. Teams might rush to “burn down” points by completing less critical tasks, which can detract from the overall goal of maximizing value delivery. This goes against the original intent of agile and the Scrum framework, which prioritizes value and adaptability over simply tracking progress.
Pressure to Meet Ideal Lines:
The ideal burndown line represents the perfect pace to finish all planned work by the end of the sprint. However, teams can feel undue pressure to match this line, leading to behaviors like inflating estimates or cutting corners to artificially match the ideal trajectory, thus compromising quality.
The focus on the ideal line also doesn’t make any sense, as Scrum is usually applied in the Complex or Complicated domain where things are unknown. We are not at an assembly line where every Sprint we work on the exact same thing, with the exact same outcome. Many things we don’t know, but Scrum invites us to experiment and fail safely. Therefore, constant deviations and even missing Sprint Goals are to be expected.
Indeed, if we didn’t miss a Sprint Goal once in a while, I would be suspicious and would invite the team in a Retrospective to discuss if
a) Our Sprint Goals are ambitious enough
b) The Definition of Done should be further tightened to increase value.
Quick detour: It’s funny, one question in the Advanced Scrum Master Exam was (I have to paraphrase):
A Scrum Team that always achieves its Sprint Goals
Possible Question in the Advanced Scrum Master exam by Scrum.org
is proof of an effective team.
✅ TRUE
⛝ FALSE
The answer they want us to select is “TRUE”. But how can this not depend on the quality of the Sprint Goals? How can this not depend on the Definition of Done? Is it “strict enough”? Tight enough?
I exaggerate here to get a point across, but assume a team comes up with a Sprint Goal that they will resolve 2 tiny Stories worth 2 working days in the next 2-weeks Sprint. The chances that they hit this Sprint Goal are extremely high. In the next 5 Sprints they come up with similar genius goals. Can we really say, hitting these goals is proof of an effective team?
Lack of Context:
Burndown and burn-up charts provide a limited view of the progress, even if applied correctly. They are focusing only on completed tasks or remaining work without offering insight into the challenges, complexities, or reasons behind changes in progress. For example, a plateau on a burndown chart could be due to a variety of reasons like unexpected issues, waiting time due to dependencies, or team absences, but the chart does not convey these nuances. This can mislead stakeholders into making incorrect assumptions about the team’s performance. So it is always important to not just dump any charts on a stakeholder, but to provide context.

Overemphasis on Quantity Over Quality
There is a risk that teams may focus on closing tasks to make the chart look good rather than ensuring the quality of the work done. For example, closing tasks quickly without thorough testing to reduce points on the chart undermines the principle of delivering a potentially shippable product increment, which is central to Scrum.
Manipulation of Scope
In burn-up charts, scope changes (adding or removing work) are visible, which can be useful but also problematic. Teams might be tempted to adjust the scope artificially to make progress look better on the chart, such as by adding minor tasks or removing difficult ones, which distorts the true picture of the project’s progress and undermines the transparency Scrum aims to promote. I want to make clear, that teams don’t usually act maliciously on purpose. It is almost always a reaction to outside pressures on the team. That is why it is so important that the Scrum Master protects the team.
In comparison to their original purpose, which is to provide transparency, facilitate progress tracking, and foster informed decision-making, these disadvantages and misuses can significantly reduce the effectiveness of burndown and burn-up charts. They should be used as tools to guide reflection and adjustment rather than strict performance measures, and teams should ensure that they are interpreted in the right context, with an emphasis on delivering value rather than merely tracking task completion.
What can we do?
Use Burndown charts if you must but use them alongside other tools for a more complete picture of progress, team performance, and value delivery in Scrum. These tools can help address some of the limitations of burndown and burn-up charts by offering more nuanced insights into team dynamics, workflow, and product quality. Here are some alternatives and additional tools:
Cumulative Flow Diagram (CFD):

- Purpose: A CFD provides a visual representation of work in progress across different stages of a workflow (e.g., to-do, in-progress, done). It helps identify bottlenecks, inefficiencies, and trends in how work is moving through the system. It offers insights into the balance between work entering and leaving the system, highlights flow issues, and allows teams to spot and address constraints more effectively than burndown charts.
Lead Time and Cycle Time Metrics:
Purpose: Lead time measures the total time from when a work item is created to when it is completed, while cycle time measures the time from when work starts on an item to when it is finished. These metrics help teams understand how long it takes to deliver work, identify delays, and improve process efficiency. They offer a clear picture of how quickly value is being delivered.
Story Mapping:
Purpose: Story mapping is a visual tool that helps teams map out the user journey and identify the necessary steps (stories) to achieve desired outcomes. It prioritizes work based on value and dependencies. It provides context and prioritization for the backlog, helping teams focus on delivering the most valuable features first, thus aligning work with user needs and business goals.
Definition of Done (DoD) and Quality Metrics:
Purpose: Establishing a clear Definition of Done ensures that completed work meets quality standards. This approach helps maintain product quality and prevents the rush to complete work at the expense of standards, offering a broader view of product readiness and technical debt.
Sprint Retrospectives and Improvement Tracking:
Purpose: Regular retrospectives allow teams to reflect on what went well, what didn’t, and what can be improved. Tracking action items from retrospectives ensures that the team continuously improves its processes. Retrospectives provide qualitative insights into team dynamics and performance that charts cannot capture, fostering a culture of continuous improvement.
Product Backlog Health Metrics:
Purpose: Metrics like backlog size, refinement progress, and readiness of stories can help gauge the health of the backlog. Ensuring that the backlog is well-groomed and prioritized ensures that the team works on the most valuable items. This ensures that the team is not just completing tasks but is aligned with the product vision and business priorities.
User Feedback and Usage Analytics:
Purpose: Collecting direct feedback from users and analyzing how they interact with the product provides insights into whether the features delivered are meeting user needs and business objectives. This user-centric approach ensures that the team’s efforts align with real-world usage and value delivery, bridging the gap between development and end-user satisfaction.
Objective and Key Results (OKRs):

- Purpose: OKRs help align team efforts with strategic goals by setting clear objectives and measurable outcomes. They provide a higher-level view of progress towards business objectives, beyond just task completion. This approach ensures that the team’s work is directly contributing to broader organizational goals, providing a strategic context for daily activities.
Using these tools in combination allows teams to gain a more holistic view of their progress, productivity, and impact, ensuring that they are not only completing tasks or burning Story Points but also delivering real value aligned with user needs and business goals.
Your team needs a Scrum Master?
Send me an email: achility(at)protonmail.com